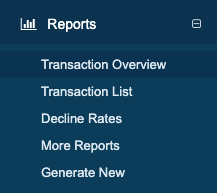
Transaction Overview
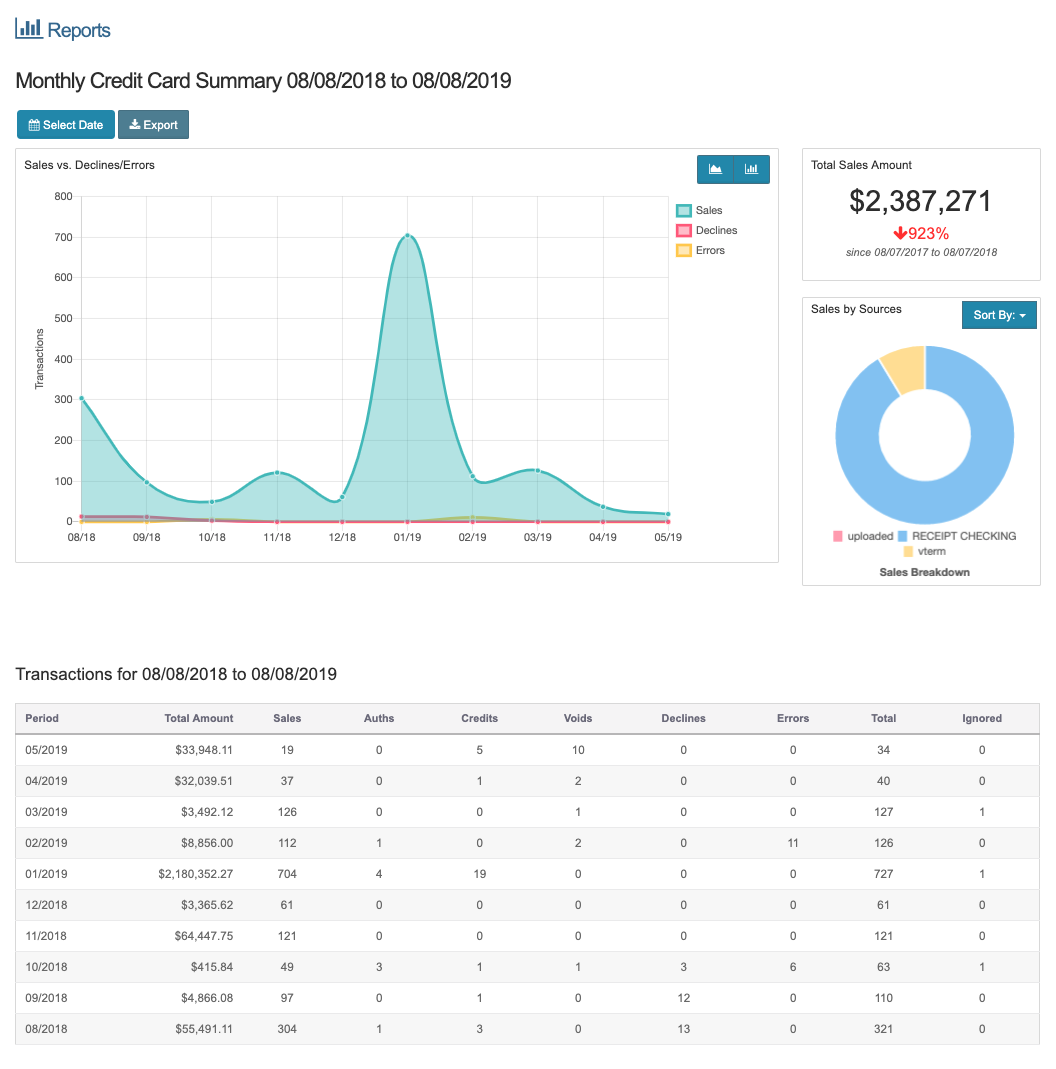
This report can be found under 'Reports' in the sidebar, then in 'Transaction Overview' in the dropdown.
Select Date
The date picker allows you to set the time range of your report. By default, when you open the report, it will show transactions from the last 12 months up to today's date.
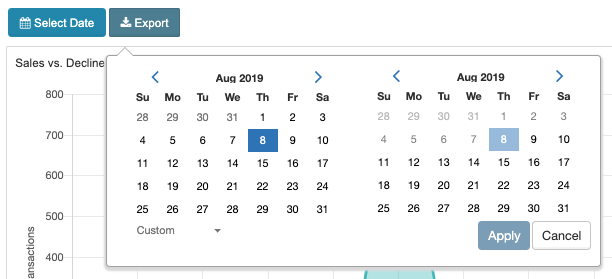
To change the range, simply click on the calendar button that shows the current range. You will then see 2 calendars, the left one is the start of the range and the right one is the end of the range.
- To create a custom range, use the arrows above each calendar to change the months one by one or click the month's name to view a dropdown of other months to select. After you have selected the month, then select a day in that month.
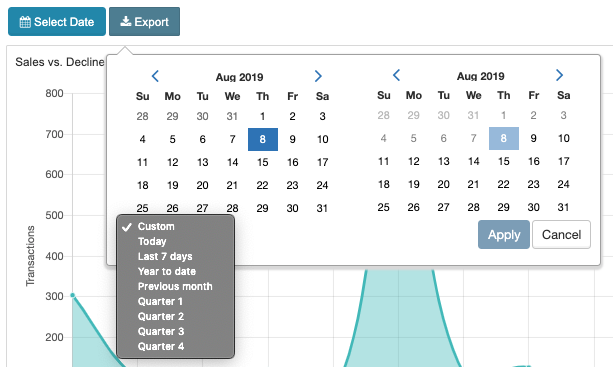
- To create a pre-made date range, click the arrow below the left calendar and then select the range you would like to use. Your selection will be reflected in the calendars. Below is a list of all the pre-made date ranges.
Once you are done, click the "Apply" button to use that range or click "Cancel" to cancel.
| Range | Description |
|---|---|
| Custom | This will display when a custom date range is selected |
| Today | Will show transactions for todays date only |
| Last 7 Days | Will show transactions for the last 7 days including todays date |
| Year to Date | Will show transactions from the beginning of this year to todays date |
| Previous Month | Will show transactions from the last month |
| Quarter 1 | Will show transactions from January to March. If you select the quarter you are currently in, the range will show last year's quarter. |
| Quarter 2 | Will show transactions from April to June. If you select the quarter you are currently in, the range will show last year's quarter. |
| Quarter 3 | Will show transactions from July to September. If you select the quarter you are currently in, the range will show last year's quarter. |
| Quarter 4 | Will show transactions from October to December. If you select the quarter you are currently in, the range will show last year's quarter. |
Export
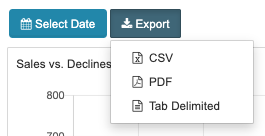
Clicking this button allows you to export the current report to one of three file formats: CSV, PDF, or Tab Delimited.
Graphs
Sales vs Declines/Errors Graph
This graph tracks all transactions in a given timeframe based on Sales, Declines, and Errors. By default this graph shows transactions of all types.
To filter out a type from the graph, click the name of the type in the legend, located on the right side of the graph. The name will then have a line through it to show it is removed from the graph.
To add the type back, simply click the name again in the legend, the line will disappear and it will be added back into the graph.
The type of graph can be changed to either a line or bar graph by clicking the corresponding icon in the top right corner. Examples of the graphs are shown below.
Line Graph
![]()
Bar Graph
![]()
Filtered Graphs
![]()
![]()
Sales By Graph
This donut graph represents the transactions based on Source, Users, and Card Type. Hovering over each section of the graph will show the amount represented in each section.
Sales By Source
![]()
Sales By User
![]()
Sales By Card Type
![]()
Sales By Card Type Filtered
![]()
To change the category, click the "Sort By:" button and a dropdown menu will appear, then select the category you want to view.
![]()
Transaction Breakdown
This report breaks down number of credit card transactions by Month, Day, and Hour.
Month View
![]()
Day View
![]()
Hour View
![]()
If looking at the monthly view (shown above), you can click on the month and the report will show the days within that month. When looking at the daily view, you can click on a day and the report will show the hours within that day. Please Note: If no transactions were processed within the time period, it won't be listed. For example, if no transactions were processed in the month of March, it will not be listed in the monthly view.
This report will break down the transactions into the following fields:
| Field | Description |
|---|---|
| Period | The date range of the transactions. Could be a month, day, or hour of the day. |
| Total Amount | The total amount in dollars of transactions within the time period. |
| Sales | Total number of credit card sales for the date range. Total dollar amount of this line counts positively towards the Total Amount. Click this field to see the related report for the given time period. |
| Auths | Total number of authorize only sales for the date range. Total dollar amount of this line counts positively towards the Total Amount. Click this field to see the related report for the given time period. |
| Credits | Total number of credit card refunds for the date range. Total dollar amount of this line counts negatively towards the Total Amount. Click this field to see the related report for the given time period. |
| Voids | Total number of voided credit card sales or refunds (credits) within the date range. Dollar amount does not count towards the Total Amount. Click this field to see the related report for the given time period. |
| Declines | Total number of credit card declines within the date range. Dollar amount does not count towards the Total Amount. Click this field to see the related report for the given time period. |
| Errors | Total number of credit card errors within the date range. Dollar amount does not count towards the Total Amount. Click this field to see the related report for the given time period. |
| Total | Total number of all transactions within the date range. Except for the transactions in the Ignored column. Click this field to see the related report for the given time period. |
| Ignored | The Ignored column contains transactions that received an error before they were sent to the credit card processor such as transaction time outs and transactions blocked by the Fraud Profiler. Click this field to see the related report for the given time period. |